The Developer Console is accessible from within your Salesforce organization, and provides a collection of tools you can use to create, edit, debug and test applications.
2. Open Developer Console
Step 1: Login Salesforce: https://login.salesforce.com/
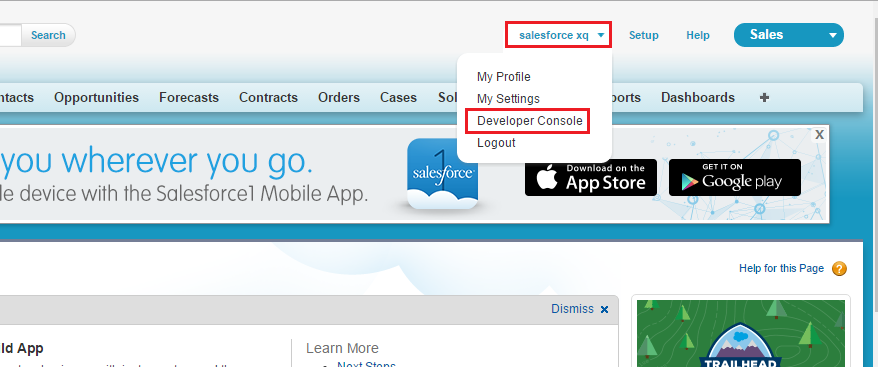
Step 2: Click Username => Click Developer Console
Step 3: Developer Console window will Appear

+ Menu bar: Can help create new file (Apex Class, Apex Trigger, Visualforce Page, ...), Open (class, trigger, page, ...), execute Apex code, Run test, ...
+ A workspace with a tab for each open item.
+ Logs tab: view a list of logs
+ Tests tab: View status of test class
+ Checkpoints tab: View your checkpoints and results
+ Query Editor: Query and view results
+ A panel View state, Problems and Progress tabs for viewing real-time execution data.
+ ...
The Developer Console can help:
+ Writing and compiling code: When you save a trigger or class, the code is automatically compiled, errors will be reported.
+ Debugging and Troubleshooting: Use the Logs, Checkpoints tab
+ Editing Source Code: Open and edit Apex class, Visualforce Page, ...
+ Testing and Validating Performance: You can execute tests of specific test classes or all classes, inspect debug logs that include database events, Apex processing, workflow, and validation logic.
+ Executing SOQL and SOSL Queries: Write, Edit and Execute SOQL and SOSL Queries. Results are displayed in a Query Results grid that allows you to open, create, update, and delete records
+ Color coding: Editor uses a color scheme for easier readability of code elements.
3. Executing Code in Developer Console
Step 1: Open Developer Console
Step 2: Goto Debug => Open Exevute Anonymous Window
OR: Ctrl + E

Step 3: Inter your code, Click Execute Button

Step 4: After Executing the code every time Log is created. To open Log go to Logs Tab and double click on the Log
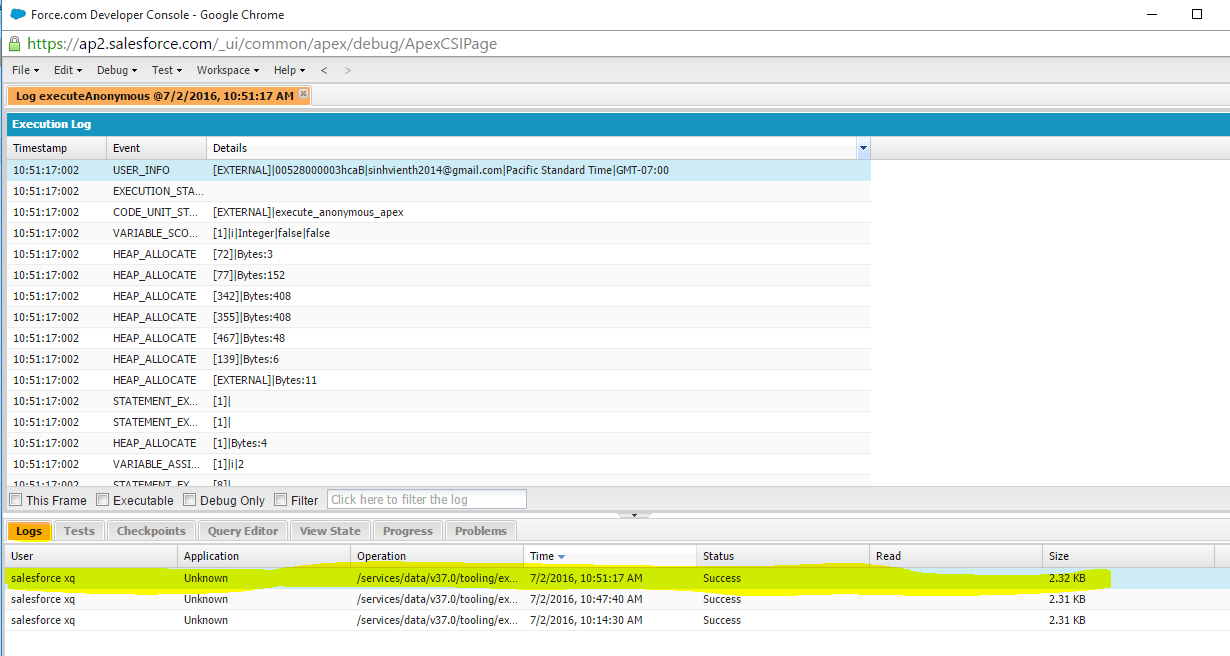
Step 5: This log contain lots of information. You can filter the results by using check boxes (This Frame, Executable, Debug Only, Filter). Example, I selected Debug Only Check box, so it will display debug log statements.

4. Executing SOQL and SOSL Queries:
Step 1: Open Developer Console
Step 2: Goto Query Editor => Input your query => And Click Execute Button

Step 3: Results are displayed in a Query Results grid that allows you to open, create, update, and delete records


Good!
ReplyDelete